
Main news from version 11 to version 12. (See Detailed changes of 11.1.xd developer releases for the full list of news).
General
- Use of Lognoter as help viewer enhancing some features (like ability to print, etc...).
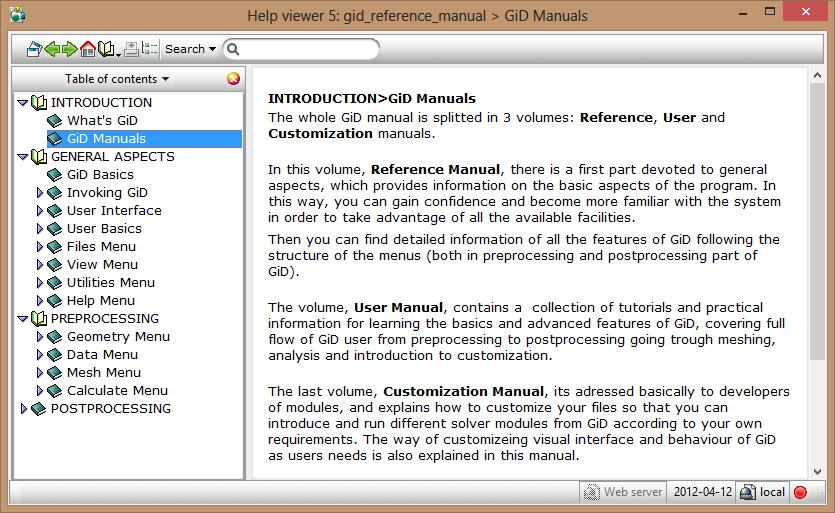
- Status bar containing mesh information, render type, etc. in the lower part of the window.
![]()

- Improved preferences window using a tree to organize the information.
...
- New octree-based volume mesher: a robust and fast unstructured tetrahedra mesher, capable to generate meshes from non-watertight definitions of the boundaries.
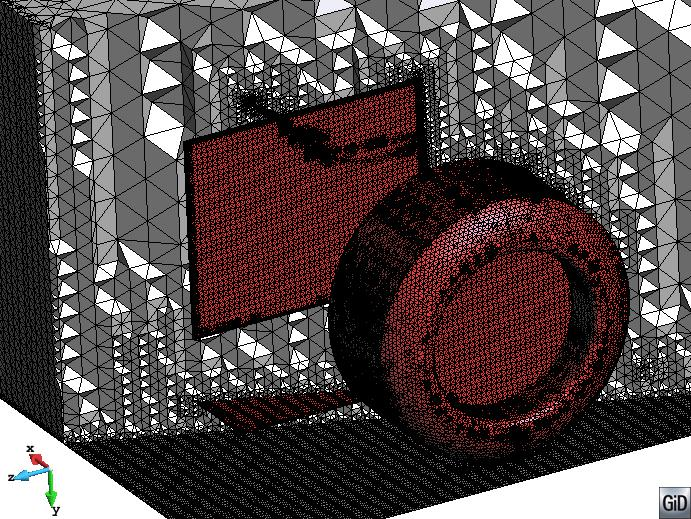
- Native groups, to better organize and assign properties (boundary conditions and materials) to the different parts of the model.
![]()
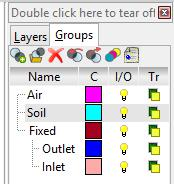
- New advance bar mesh window, showing memory and time consumed graph along time.
![]()
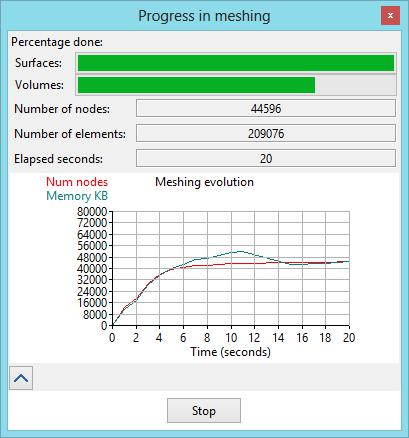
- Parallelization of mesh of volumes and surfaces
...
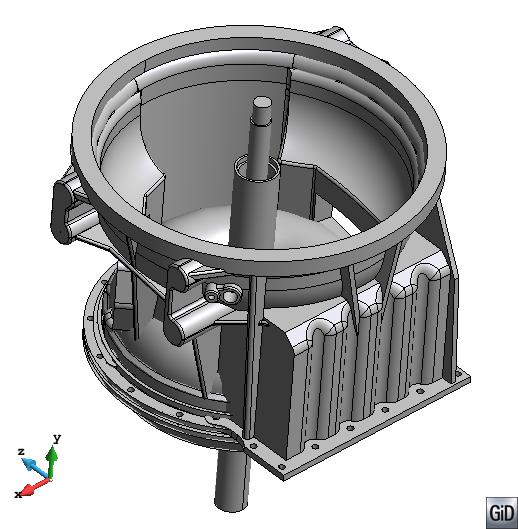
- STEP CAD format import (AP 214)
![]()
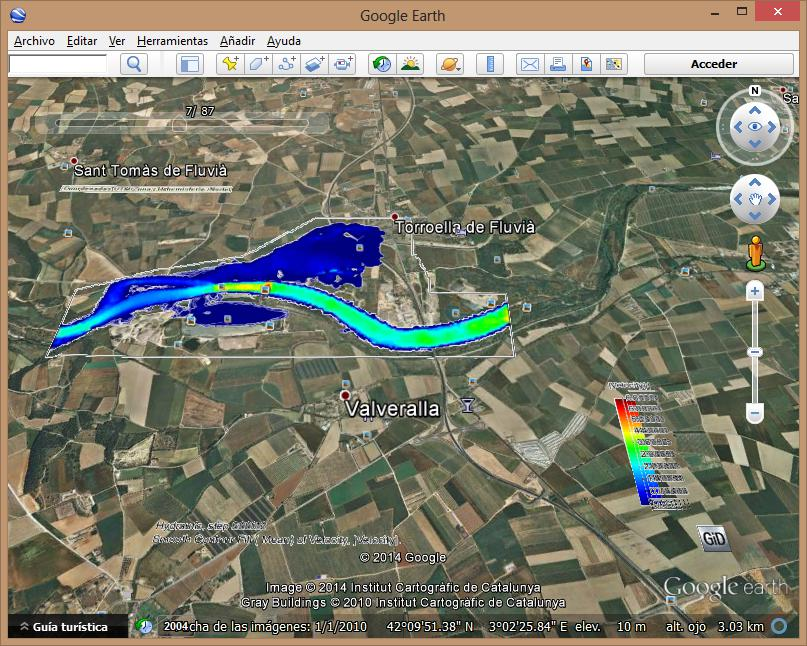
- KML plugin, to import 'Google Earth' .kml/.kmz meshes in preprocess, and export results in postprocess.
![]()
Postprocessing
- 2D polygonal cut, new Line Thickness result visualization, smoothed gauss points results integrated in contour fill, lines, isosurfaces and other result visualizations.
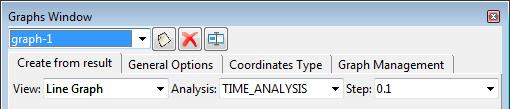
- New graphs window (allow multiple graphs, etc)
![]()
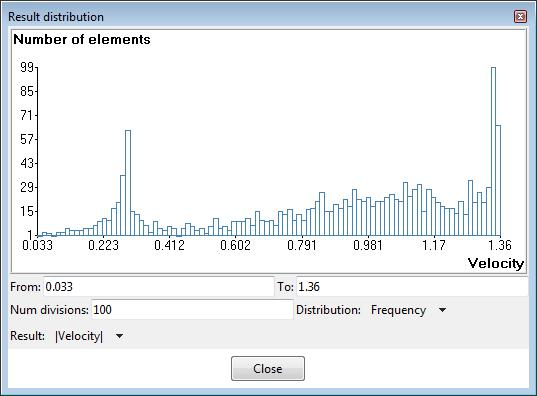
- Result distribution window: to show a graph of frequency distribution of nodes or elements by result spans.
- New Vtk format export (xml version .vtu, .vtp) and enhanced the Vtk import
![]()
- New Calculix plugin, to import 'Calculix' .frd mesh and results in postprocess (Files->Import->Calculix...)
- Huge meshes: new simplification mode for visualizing huge meshes, can be user switchable through
 in the icon bar, or enabled as 'Fast rotation' mode. Geometric criteria is used and then results are interpolated at each result visualization, like c.fill and display vectors.
 - Huge results files: enchanced and faster accesses using 'results cache'.
...