...
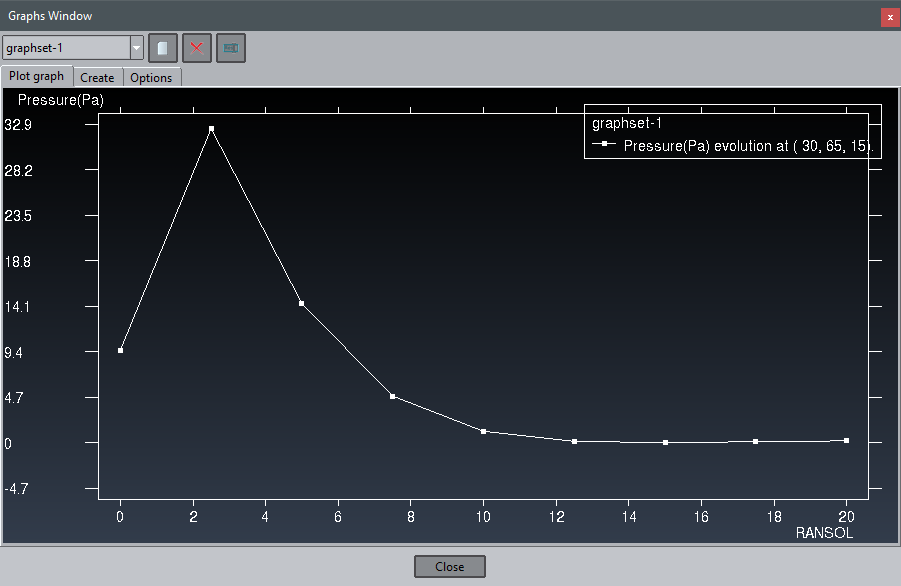
- Select View results->Graphs->Point evolution->Pressure (Pa)
- Write 30 65 15 in the command line in order to specify the point
- Affter pressing the Escape key, or the middle mouse button, the graph will be shown in a separate window:
The graph is created in the graphset-1. We will create another graph in the same graph set.
The Line graph displays a graph defined by the line connecting two selected nodes of surfaces or volumes, or any arbitrary points on any projectable surface and in any position.
- Select View results->Default analysis/step->RANSOL->0
- Select View results->Graphs->Line graph->Pressure(Pa)
- Write 30 -100 0 in the command line in order to specify the initial point
- Write 30 200 0 in the command line in order to specify the final point
...