...
- Import plug-in: added support for complex scalar and complex vector results, now they can be imported too.
- Graphs: corrected some bugs related to undefined results and importing graphs with no titles.
- Spheres: support for VA and VBO for faster drawing of nice spheres.
- Display vectors: corrected bug which caused gid to crash after this sequence: open multiple files + c.fill of resA + animate + displayVectors of resB + (zoom in) + animate AND c.fill was done using textures AND display of monochrome vectors.
- Standard (internal) gauss points (GP_TRIANGLE_1, GP_QUADRILATERAL_4, ...) should not be explictly defined to be used.
- Delaunay: elements bigger than 10 times ( default) the mean size of elements are culled. Check Utilities --> Variables --> PostDelaunauCullBigElements to modify it.
- Macros: Added macro to create a result with the minimum, maximum or average value of a scalar for all steps.
- Create Results: added some single operator functions ( sqrt, log10, db10, db20, abs, exp, inverse (1/)) to Window-->Create Result...
- Graphs: new tcl Tcl command GiD_Graph
- ** GiD_Graph show --> shows the graphs
- ** GiD_Graph hide --> hides the graphs
- ** GiD_Graph list --> list the existant graphs
- ** GiD_Graph clear --> deletes all graphs
- ** GiD_Graph get <graph_name> --> gets the graph data of "graph_name", the same as the create data.
- ** GiD_Graph delete <graph_name> --> deletes the graph "graph_name" causing an error if does not exists
- ** GiD_Graph create <graph_name> <label_x> <label_y> <list_x_values> <list_y_values> <unit_x> <unit_y> --> creates the graph "graph_name" with the provided information, causing an error if the graph already exists.
- Graphs: added discrete Fourier Transform of a Graphs. Uses the y values as real part and 0 as the imaginary part for the fft transformation. The graph created will use an index for the x axis and the real, imaginary or module of the dft result as the y axis. Check Options->Graphs>dFT>Graphs>dFT->real , imaginary or module
- Graphs: added discrete Fourier Transform of a Graphs. Uses the x values as real part, and the y values as imaginary part for the fft transformation. The graph created will use an index for the x axis and the real, imaginary or module of the dft result as the y axis. Also the graph created can have as x axis the real part and as y axis the imaginary part of the dft result. Check Options->Graphs>dFT >Graphs>dFT complex->real , imaginary, module or complex
- Read of postprocess files with GiD postprocess HDF5 format written by the GiDPost library, and postprocess files with Amelet HDF5 format.
- Create Results: added option for operators +, , * and / which now accepts a scalar or vector ( both can be complex) as second operand check the window: Window->Create Result...
- Create Results: added operators sqrt, log10, db10, db20, abs, exp, inverse (1/) which operates on one result. Only operators +, -, ** or */ accept scalars,vectors or results as second operand. SqrtAbs, Abs, Log10Abs, Exp, 1/ requires a result as second operator.

- New Create Graphs window: to create graphs from another ones, with following operators: +, -, *, /, sqrt, log10, db10, db20, abs, exp, inverse (1/), derivate, integral and fit. The "g1 fit g2" operator fits the bounding box of the second graph g2 to the bounding box of the graph g1. Also interpolator has been added: CubicSpline and Catmull-Rom Spline. Graphs can also be scaled and translated in order to match another one. This is the new window, and below some interpolated graphs examples.


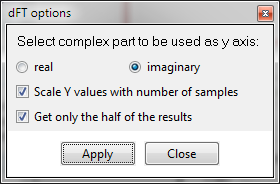
- Create Graphs: added dFT options:
- create graph( idx, dft.real) or dft( idx, dft.imaginary)
- sale y values according to the number of items
- get half the values, dft seems to be symmetric
- Graphs: corrected bug when doing line graphs on volumes
- Animation + several results: corrected bug when doing animation of several results combination isosurface iso-surface + contour fill
- Result state: corrected bug which caused the results menu not to be displayed when an incorrect step was present in the result state file (.vv)
- Integration graph: added tangencial tangential and un projected vector integration for lines and 2d
- Graphs: now, if the Amelet plugin is present, they can be exported to the Amelet HDF5 format
- Post preferences: circumvented the problem that overwrites the user preferences with original ones.
- Graphs: corrected bug in Options --> Graph --> Invert Graphs .
- Label results: now labels of vectors, tensors and local axes displays a letter with the component's name.
- Extract boundaries: corrected bug when creating boundaries from a quadratic element mesh
- VA + VBO: now quadratic elements are drawn as several triangles / quadrilaterals, instead of drawing them as linear elements if Utilities --> Preferences --> Graphical --> DrawQuadraticElements is set to "As lines".